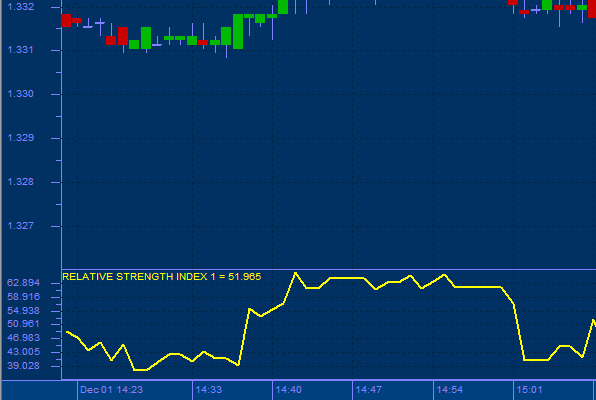
Relative Strength Index
Developed by J. Welles Wilder the Relative Strength Index (“RSI”) is a popular oscillator, which compare the internal strength of a single instrument. The RSI compares the magnitude of a instrument’s recent gains to the magnitude of its recent losses and turns that information into a number that ranges from 0 to 100. It takes a single parameter, the number of time periods to use in the calculation. Wilder recommends using 14 periods. The Relative Strength Index compares upward movements in closing price to downward movements over a selected period. Wilder originally used a 14 periods, but 7 and 9 periods are commonly used to trade the short cycle and 21 or 25 periods for the intermediate cycle. It is also formulated to fluctuate between 0 and 100, enabling fixed Overbought and Oversold levels.
Usage:
The Relative Strength Index compares upward movements in closing price to downward movements over a selected period. Wilder recommended using 70 and 30 and overbought and oversold levels respectively. Generally, if the RSI rises above 30 it is considered bullish for the underlying stock. Conversely, if the RSI falls below 70, it is a bearish signal. Some traders identify the long-term trend and then use extreme readings for entry points. If the long-term trend is bullish, then oversold readings could mark potential entry points.

