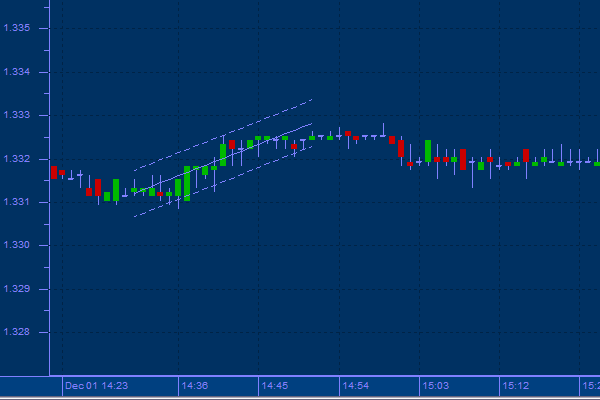
Raff Regression
Developed by Gilbert Raff, the regression channel is a line study that plots directly on the price chart. The Regression Channel provides a precise quantitative way to define a price trend and its boundaries.
The Regression Channel is constructed by plotting two parallel, equidistant lines above and below a Linear Regression trend line. The distance between the channel lines to the regression line is the greatest distance that any one high or low price is from the regression line. Raff regression Channels contain price movement, with the bottom channel line providing support and the top channel line providing resistance. Prices may extend outside of the channel for a short period of time. However, if prices remain outside the channel for a long period of time, a reversal in trend may be imminent.
The Raff Channel is a set of channels, which result when linear regression is applied to the closing price between a low in the price data and a high in the price data. Parallel lines to the regression line are drawn to indicate the position of significant highs and lows.
Usage
This method finds the maximum distance between any closing price and the regression line. This distance is then used as the basis for the channels. The channels are drawn parallel to the regression line, at a distance above and below the line equal to the maximum distance computed. The upper channel is then used for support, while the lower channel is used for resistance.

