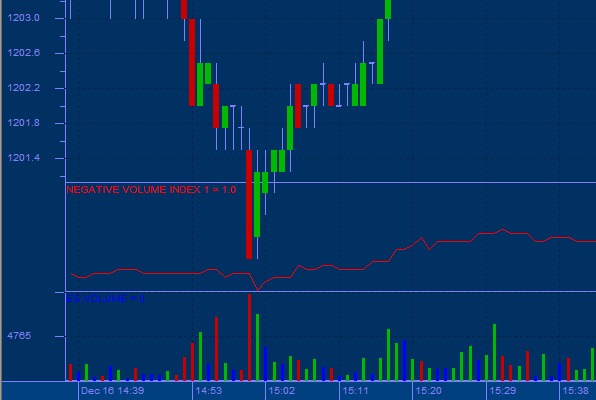
Negative Volume Index
The Negative Volume Index (NVI) focuses on periods where the volume decreases from the previous period. The premise being that the smart money takes positions when volume decreases. This index that tries to determine what experienced traders are doing by looking at periods where trading volume has decreased from the previous period, under the belief that unusually high volume is a sign that inexperienced traders are moving the markets.
The Negative Volume Index (NVI) was developed to provide buy signals on a given equity when the price is trending upward while the volume is trending downward. The premise behind this indicator is that price changes on high volume days are a result of uninformed traders while price changes on decreased volume are due to informed traders. Per this premise, increases in the NVI are taken as indicative of smart money buying into the stock. Trend reversals are indicated by crossovers with a signal line which is a 255-period moving average of the NVI.
Bull markets are presumed to occur when the NVI is above its 255-period moving average. Buy (long) signals are issued when the NVI crosses above its 255-period moving average. Sell (short) signals are issued when the NVI crosses below its 255-period moving average.
Usage:
The interpretation of the NVI assumes that when volume increases, the crowd-following uninformed traders are in the market. Conversely, with decreased volume, the “smart money” is quietly taking positions. Thus, the NVI displays what the smart money is doing.

