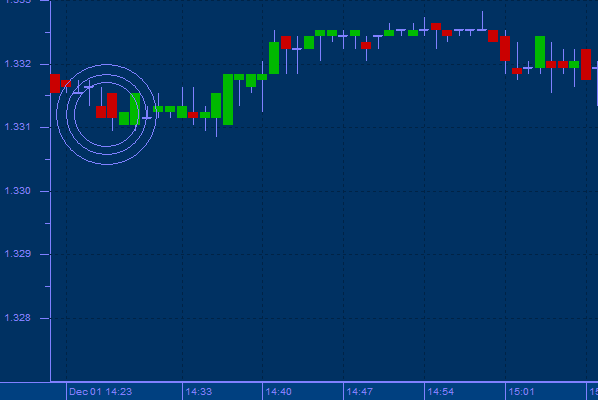
Fibonacci Arcs
Fibonacci numbers are a sequence of numbers in which each successive number is the sum of the two previous numbers. . There are some interesting relationships among numbers that are formed as the sum of the previous two numbers in a series (e.g. 1,1,2,3,5,8,13,21,34,55,89…). Further it is noted that these numerical patterns repeat themselves throughout nature.
The Fibonacci Arcs display three arcs (actually half circles) at “Fibonacci Intervals”. These intervals are defined as 38.2%, 50% and 61.8% of the distance between a price maximum and minimum. The Fibonacci Arcs are drawn from typical tops or bottoms. The Fibonacci Arcs project into the future, and as the prices pass these three arcs, traders make predictions about future price movements based upon whether there appears to be price resistance or support at these points. If on a downtrend, there appears to be support where the arcs cross the prices, this is bullish.
Fibonacci Arcs are built as follows: first, the trend line is drawn between two extreme points, for example, from the trough to the opposing peak. Then three arcs are built having their centers in the second extreme point and intersecting the trend line at Fibonacci levels of 38.2, 50, and 61.8 per cent.
Usage
Fibonacci arcs are considered to be potential support and resistance levels. Fibonacci Arcs and Fibonacci Fans are usually plotted together on the chart, and support and resistance levels are determined by the points of intersection of these lines. Arcs combine time and price to display expected containment of price action over time. Circles are used to identify the significant high and low used for these indicators.

