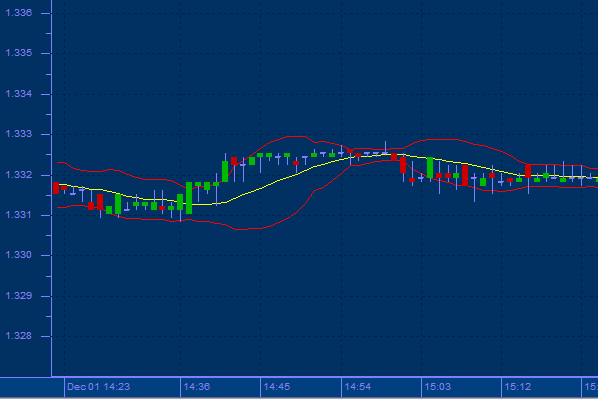
Bollinger Band
A Bollinger Bands are lines plotted in and around the price structure to form an “envelope.” It is the action of prices near the edges of the envelope. Bollinger Bands are based upon a simple moving average. This is because a simple moving average is used in the standard deviation calculation . John Bollinger developed the technique of using moving averages with two trading bands.
The indicator consists of three bands designed to encompass the majority of an instrument’s price action.
-
A simple moving average in the middle
-
An upper band (SMA plus 2 standard deviations. Close price or the average of High, Low and Close are usually used to calculate the SMA. Standard Deviation is a statistical term that provides a good indication of volatility. Using the standard deviation ensures that the bands will react quickly to price movements and reflect periods of high and low volatility.)
-
A lower band (SMA minus 2 standard deviations)
Bollinger recommends using a 20-period simple moving average for the center band and 2 standard deviations for the outer bands. The length of the moving average and number of deviations can be adjusted to better suit individual preferences and specific characteristics of an instrument.
Usage:
Bollinger Bands are an indicator that allow comparing volatility and relative price levels over a period. It can be combined with price action to generate signals and foreshadow significant moves.
It serves many functions:
-
To identify periods of high and low volatility
-
To identify periods when prices are at extreme, and possibly unsustainable, levels.
-
To arrive at rigorous buy and sell decisions.

